Default
Rule 1:
The Field “Default” will always be used in a study’s properties, unless you specifically tell the application to use another price field, such as “High”, “Low”, or “Open”.
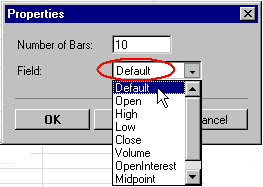
Let’s look at an example. The Momentum study is applied to a daily Corn chart. The calculation for Momentum is:
- MOM = (Value of the current day’s bar) – (Value from 10 days ago)
With Momentum’s properties set to “Default”, the “Value” used in the calculation is the Close Price. However, if Momentum was applied to a daily expression chart (C1! – W1!), the expression does not have a “Close” price. Therefore, the “Value” will be the expression’s result for the specific bar. The study uses the “Default” value available in the underlying price data.
Rule 2:
When a study is applied to a Symbol, “Default” = “Close” (a symbol will always have a “Close” price on which the study can perform its’ calculation). When the study is applied to an expression, “Default” = the expression’s result for the given bar.
When a study is initially applied to a Symbol, the Symbol naturally has data such as “Open”, “High”, “Low”, “Close”, etc. Examination of a study’s properties, when applied to a Symbol, will reveal a drop-down box (as shown in the Properties illustration, above).
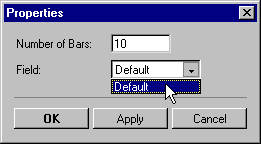
However, when the study is initially applied to an expression, the only data available on which to apply a study is the expression’s result.
Examination of a study’s properties, when applied to an expression, will ONLY reveal the “Default” field as an option:
Rule 3:
A study stays “bound” to the Field on which it was initially calculated.
Let’s go back to our original example. You apply the Momentum study to a daily Corn chart. However, you change the study’s properties to calculate Momentum based on the “High” price field. Momentum’s calculation is now “bound” to the “High” price of the underlying data.
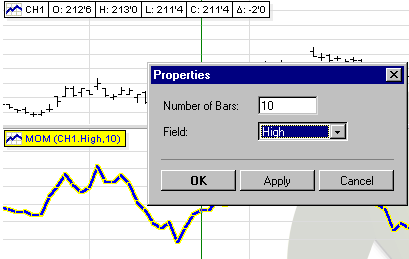
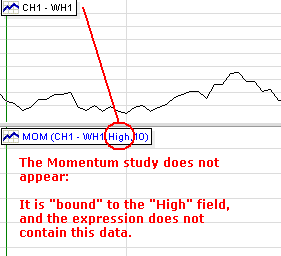
Now, you change the Symbol from Corn to an expression: Nearby Corn – Nearby Wheat. Because Momentum is “bound” to the “High” price of the underlying data (and because an expression does not have a “High” price), the chart cannot show the Momentum study.
View Other Technical Analysis Studies
- Bollinger Bands
- Commodity Channel Index
- Crack Spread
- Crush Spread
- Default
- Directional Movement Index
- Envelope
- Exponential Moving Average
- Exponential Oscillator
- High Low Moving Average
- Highest High / Lowest Low
- Historic Volatility
- Keltner Channel
- Least Squares Linear Regression
- Line Oscillator
- Momentum
- Moving Average
- Moving Average Convergence Divergence
- Moving Standard Deviation
- Open Interest
- Oscillator
- Parabolic Stop and Reversal
- Rate of Change
- Relative Strength Index
- Smoothed Moving Average
- Smoothed Oscillator
- Stochastic
- Variable Moving Average
- Volume
- Volume and Open Interest
- Weighted Close
- What is the Slow Stochastic Oscillator?
- Williams’ %R

